

Last Updated on: 31st July 2026, 01:05 pm
TL;DR:
- Core Web Vitals are essential Google metrics that influence search rankings and user perception of your site. Improving TTFB, LCP, INP, and CLS in that order maximizes performance gains based on browser loading patterns and user experience. Regular monitoring and addressing server response times alongside front-end optimizations are crucial for maintaining strong Core Web Vitals.
Core Web Vitals are Google’s three user experience metrics, Largest Contentful Paint (LCP), Interaction to Next Paint (INP), and Cumulative Layout Shift (CLS), that directly affect your search rankings and how visitors perceive your site. Google scores these metrics at the 75th percentile of real-user data, meaning 75% of your actual visits must hit the passing thresholds: LCP under 2.5 seconds, INP under 200ms, and CLS under 0.1. Knowing how to improve core web vitals is not optional if you care about page experience and organic traffic. Tools like Google Search Console, the Chrome User Experience Report (CrUX), and the Web Vitals JavaScript library give you the field data you need to measure where you actually stand. This guide walks you through each metric in priority order so you fix the right things first.
How to improve core web vitals: the priority workflow
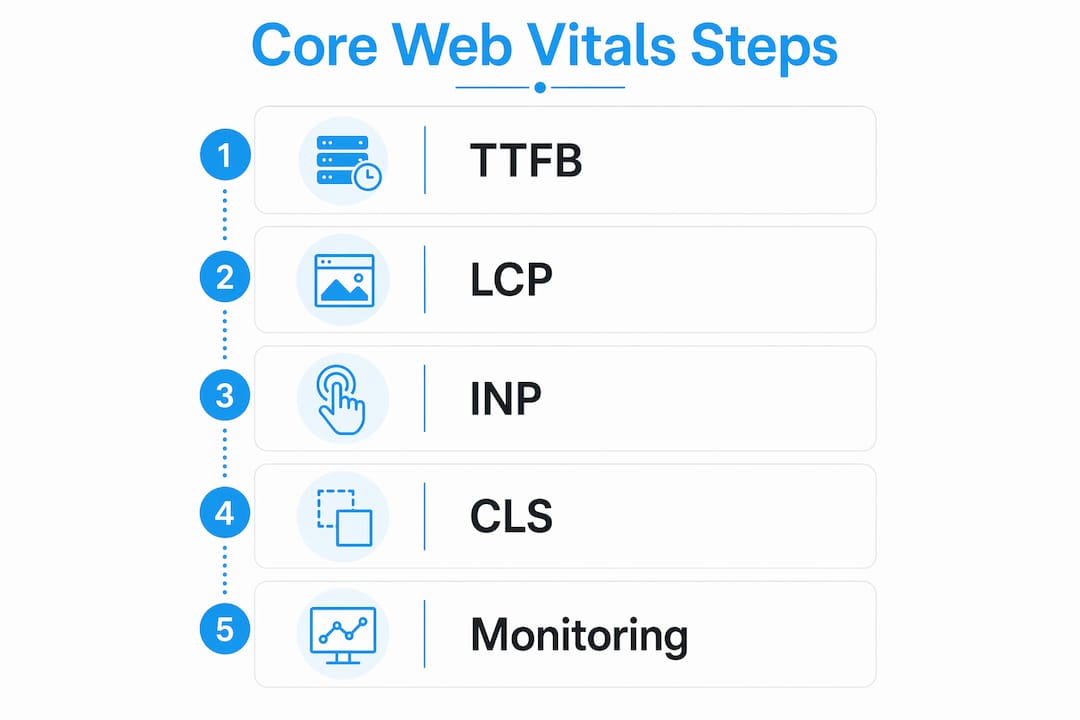
Optimizing Core Web Vitals works best when you follow a systematic priority order: TTFB first, then LCP, then INP, then CLS. Skipping ahead wastes effort. If your server responds slowly, no amount of image compression will save your LCP score.
Here is how the priority order breaks down and why each step matters:
| Priority | Metric / Area | Why it comes first |
|---|---|---|
| 1 | Time to First Byte (TTFB) | Slow server response delays every other resource on the page |
| 2 | Largest Contentful Paint (LCP) | Hero image or headline is what users see first; it sets perceived speed |
| 3 | Interaction to Next Paint (INP) | Unresponsive clicks and taps drive users away even on fast-loading pages |
| 4 | Cumulative Layout Shift (CLS) | Layout jumps erode trust and cause accidental clicks |
Server response time (TTFB) is the first priority because fixing it improves the loading baseline for every other resource. A slow host or uncached server response will hold back your LCP no matter what else you do. Start by checking your TTFB in Google Search Console or PageSpeed Insights. If it exceeds 600ms, your hosting environment or caching configuration needs attention before anything else.
Once TTFB is under control, move to LCP, then tackle INP and CLS. Each fix builds on the previous one. This order is not arbitrary. It reflects how browsers load pages and how users experience them.
Pro Tip: Run your site through PageSpeed Insights before touching any code. The report groups issues by metric and flags the highest-impact opportunities first, saving you hours of guesswork.
How to optimize Largest Contentful Paint for faster load times
LCP measures how long it takes for the largest visible element, usually a hero image or an H1 heading, to render on screen. The target is under 2.5 seconds for 75% of real visits.
Add
fetchpriority="high"to your hero image. Adding this attribute improved LCP from 2.6s to 1.9s in documented tests. That single HTML attribute tells the browser to fetch the image before other lower-priority resources.Never lazy-load your LCP image. Applying
loading="lazy"to the hero image delays its load by 200–500ms, which directly tanks your LCP score. Reserve lazy loading for images below the fold only.Convert images to WebP or AVIF. Both formats deliver significantly smaller file sizes than JPEG or PNG at comparable quality. Smaller files load faster, especially on mobile connections.
Inline critical CSS. Render-blocking stylesheets force the browser to pause before painting anything. Inlining the CSS rules needed for above-the-fold content removes that pause entirely.
Preload key assets. Use
<link rel="preload">for your LCP image, critical fonts, and any CSS that affects the hero section. Preloading tells the browser to fetch these assets early in the loading process.Use a Content Delivery Network (CDN). A CDN serves static assets from servers near your users, cutting latency and reducing TTFB for visitors far from your origin server. Cloudflare, BunnyCDN, and AWS CloudFront are widely used options.
Pro Tip: Use Chrome DevTools’ Performance panel to confirm which element the browser identifies as your LCP. Sometimes it is not the image you expect. A large background div or an unoptimized text block can be the culprit.
A common troubleshooting mistake is assuming the LCP element is always an image. If your LCP element is hidden behind CSS or loaded via JavaScript, the browser cannot detect it early. Keep your hero content in plain HTML, not injected dynamically after page load.

What strategies reduce Interaction to Next Paint latency?
INP replaced First Input Delay (FID) as a Core Web Vital in 2024. It measures the time from any user interaction, a click, tap, or keypress, to the next visual update on screen. The passing threshold is under 200ms.
The main cause of high INP is JavaScript blocking the browser’s main thread. When the browser is busy executing a long script, it cannot respond to user input. Here is how to fix that:
Break up long JavaScript tasks. Any task running longer than 50ms on the main thread is considered a “long task.” Breaking these into smaller phases reduces INP latency by 200–300ms in real-world cases. Use
scheduler.yieldorrequestIdleCallbackto hand control back to the browser between chunks, so it can process user input sooner.Remove unused JavaScript. Audit your bundles with Chrome DevTools Coverage tab. Unused code still parses and compiles, consuming main-thread time even if it never runs.
Split your JavaScript bundles. Tools like Webpack and Vite support code splitting, which loads only the JavaScript needed for the current page. This reduces parse time and frees up the main thread faster.
Defer non-critical scripts. Add
deferorasyncattributes to scripts that do not affect the initial render. Third-party scripts from analytics platforms, chat widgets, and ad networks are frequent INP offenders.Lazy-load third-party scripts. Load tools like Intercom, Hotjar, or Google Tag Manager only after the page has fully loaded and the user has had a chance to interact. This keeps the main thread clear during the critical interaction window.
Use
content-visibility: auto. This CSS property tells the browser to skip rendering off-screen content until the user scrolls to it. On long pages, this can free up significant main-thread time during initial load.
For deeper guidance on interaction design and INP, understanding how users interact with your interface helps you prioritize which scripts to defer first.
How to minimize Cumulative Layout Shift for visual stability
CLS measures how much page content moves unexpectedly while the page loads. A score under 0.1 is the target. Layout shifts frustrate users and cause accidental clicks on the wrong elements.
Set explicit dimensions on images and videos. CLS issues are mostly caused by images and videos without defined
widthandheightattributes or a CSSaspect-ratioproperty. Without these, the browser does not know how much space to reserve, so content jumps when the media loads.Reserve space for ads and embeds. If you display banner ads or embedded content, define a fixed container size in CSS before the content loads. An empty box that fills in is far better than content that pushes everything else down.
Use
font-display: swapfor web fonts. Loading fonts with font-display: swap reduces invisible text and prevents layout shifts caused by font swapping. Pair this with a well-configured fallback font that closely matches your web font’s metrics to minimize the visual jump when the custom font loads.Avoid inserting content above visible content dynamically. Banners, cookie notices, and notification bars that appear above existing content after load are a leading cause of high CLS. Either render them server-side or reserve their space in the initial layout.
Animate with
transformandopacityonly. Animating properties likeheight,margin, ortoptriggers layout recalculations and causes shifts. Usingtransform: translateY()instead moves elements without affecting surrounding content.
Pro Tip: Google Search Console’s Core Web Vitals report groups URLs by issue type. If CLS is flagged across multiple pages, check for a shared template element like a header banner or font loading pattern that affects all of them at once.
Monitor CLS regularly using the CrUX dashboard or a Real User Monitoring (RUM) tool. Field data updates over 28-day rolling windows, so improvements you make today will take up to four weeks to fully reflect in your official scores.
What I have learned from maintaining Core Web Vitals on live sites
One of the most common mistakes I see is treating Core Web Vitals as a one-time fix. It’s easy to run PageSpeed Insights, make a few changes, celebrate the green scores, and move on. But performance rarely stays the same. A new plugin, third-party script, or redesigned hero section can quietly undo months of optimization work.
Relying solely on Lighthouse lab data is not enough. Lab tools simulate a single load under controlled conditions. Real users arrive on different devices, networks, and browsers. Field data from CrUX tells you what is actually happening. I check both, but I trust field data for decisions.
The fix that surprises most people is how much server response time matters. I have seen sites with beautifully optimized images and deferred scripts still fail LCP because the host was slow. Upgrading to a faster hosting plan or adding a CDN fixed what months of front-end work could not. Good hosting support and uptime are not glamorous topics, but they underpin everything else.
My honest advice: prioritize fixes that users actually notice. A layout shift that moves a button mid-click is more damaging to trust than an LCP that is 2.7 seconds instead of 2.4. Fix what hurts the experience first, then chase the numbers.
— Stefan
Find the right hosting to support your performance goals
Your Core Web Vitals improvements will only go as far as your hosting allows. A slow server response time (TTFB) undermines every front-end optimization you make. At Digi Host Guide, we review and compare hosting providers specifically for speed, reliability, and value, so you can find a plan that supports your performance goals from the ground up. Whether you run a small business site or a high-traffic store, the right host makes a measurable difference. You can check our top hosting providers list for a curated shortlist of the fastest options available right now.
FAQ
What are the three Core Web Vitals metrics?
The three Core Web Vitals are Largest Contentful Paint (LCP), Interaction to Next Paint (INP), and Cumulative Layout Shift (CLS). Google uses these to measure loading speed, interactivity, and visual stability respectively.
How does Google score Core Web Vitals?
Google evaluates Core Web Vitals at the 75th percentile of real-user sessions, meaning 75% of visits to a URL must pass the thresholds for that page to receive a “Good” rating.
Why is my LCP score still failing after image optimization?
A common cause is lazy loading applied to the hero image, which delays loading by 200–500ms. Remove loading="lazy" from your LCP image and add fetchpriority="high" instead.
How long does it take to see Core Web Vitals improvements in Google Search Console?
Field data in the Chrome User Experience Report updates over 28-day rolling windows. Fixes you apply today will take up to four weeks to fully appear in your official scores.
What is the fastest way to reduce INP on a slow page?
Break up JavaScript tasks that run longer than 50ms on the main thread. Splitting long tasks into smaller chunks using scheduler.yield allows the browser to handle user input between them, reducing INP latency significantly.

